Work
Portfolio
Geospatial analysis, policy presentations, and data visualizations
 Story Map
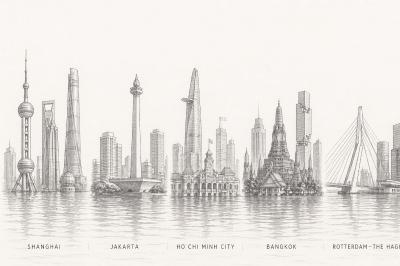
5 Coastal Cities with High Exposure to Sea-Level Rise
ArcGIS Story Map profiling five major coastal cities facing significant climate risk from rising sea levels, examining population exposure and urban vulnerability.
View Story Map →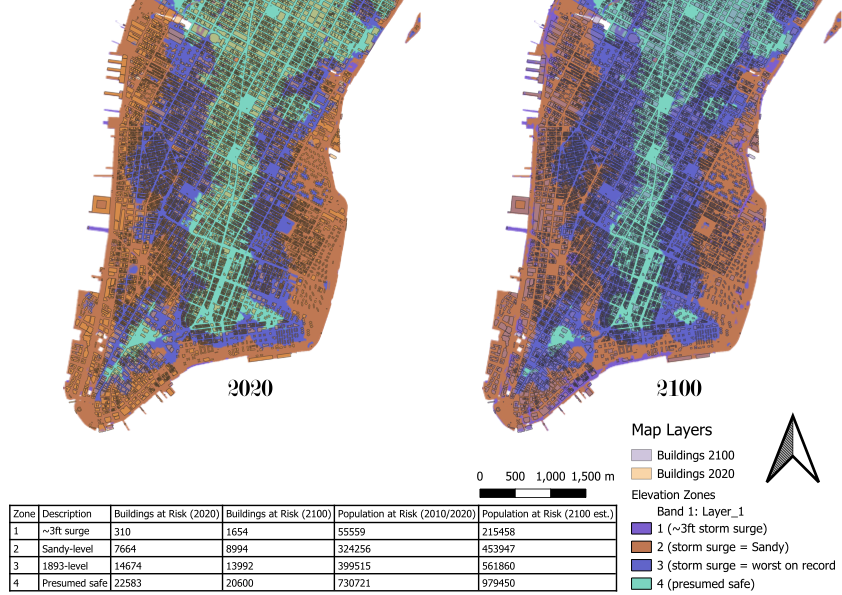 GIS
GIS
Census & Building Spatial Analysis
Comparative spatial analysis of census demographics and building infrastructure between 2020 and 2100 projections.
View Project →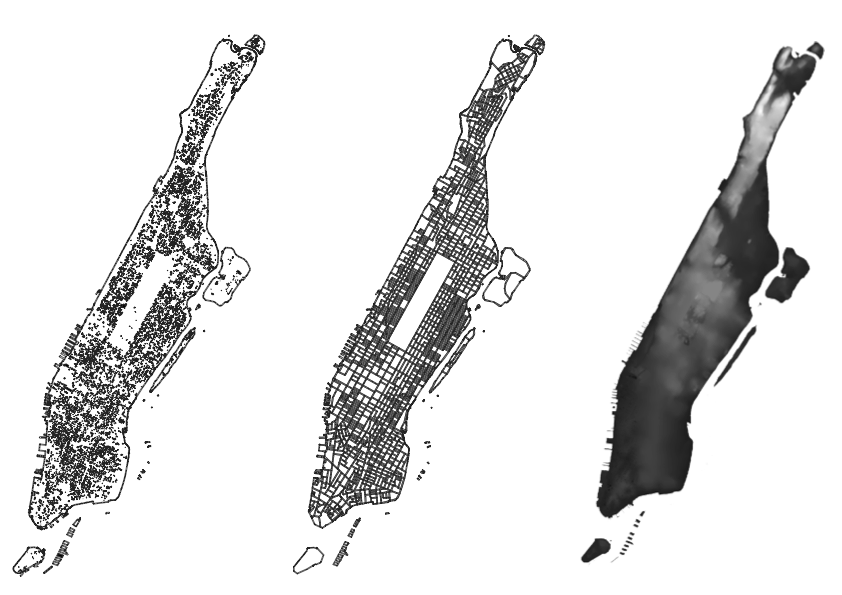 GIS
GIS
Manhattan Building Database
Geospatial database analysis of Manhattan building footprints and administrative boundaries using QGIS.
View Project →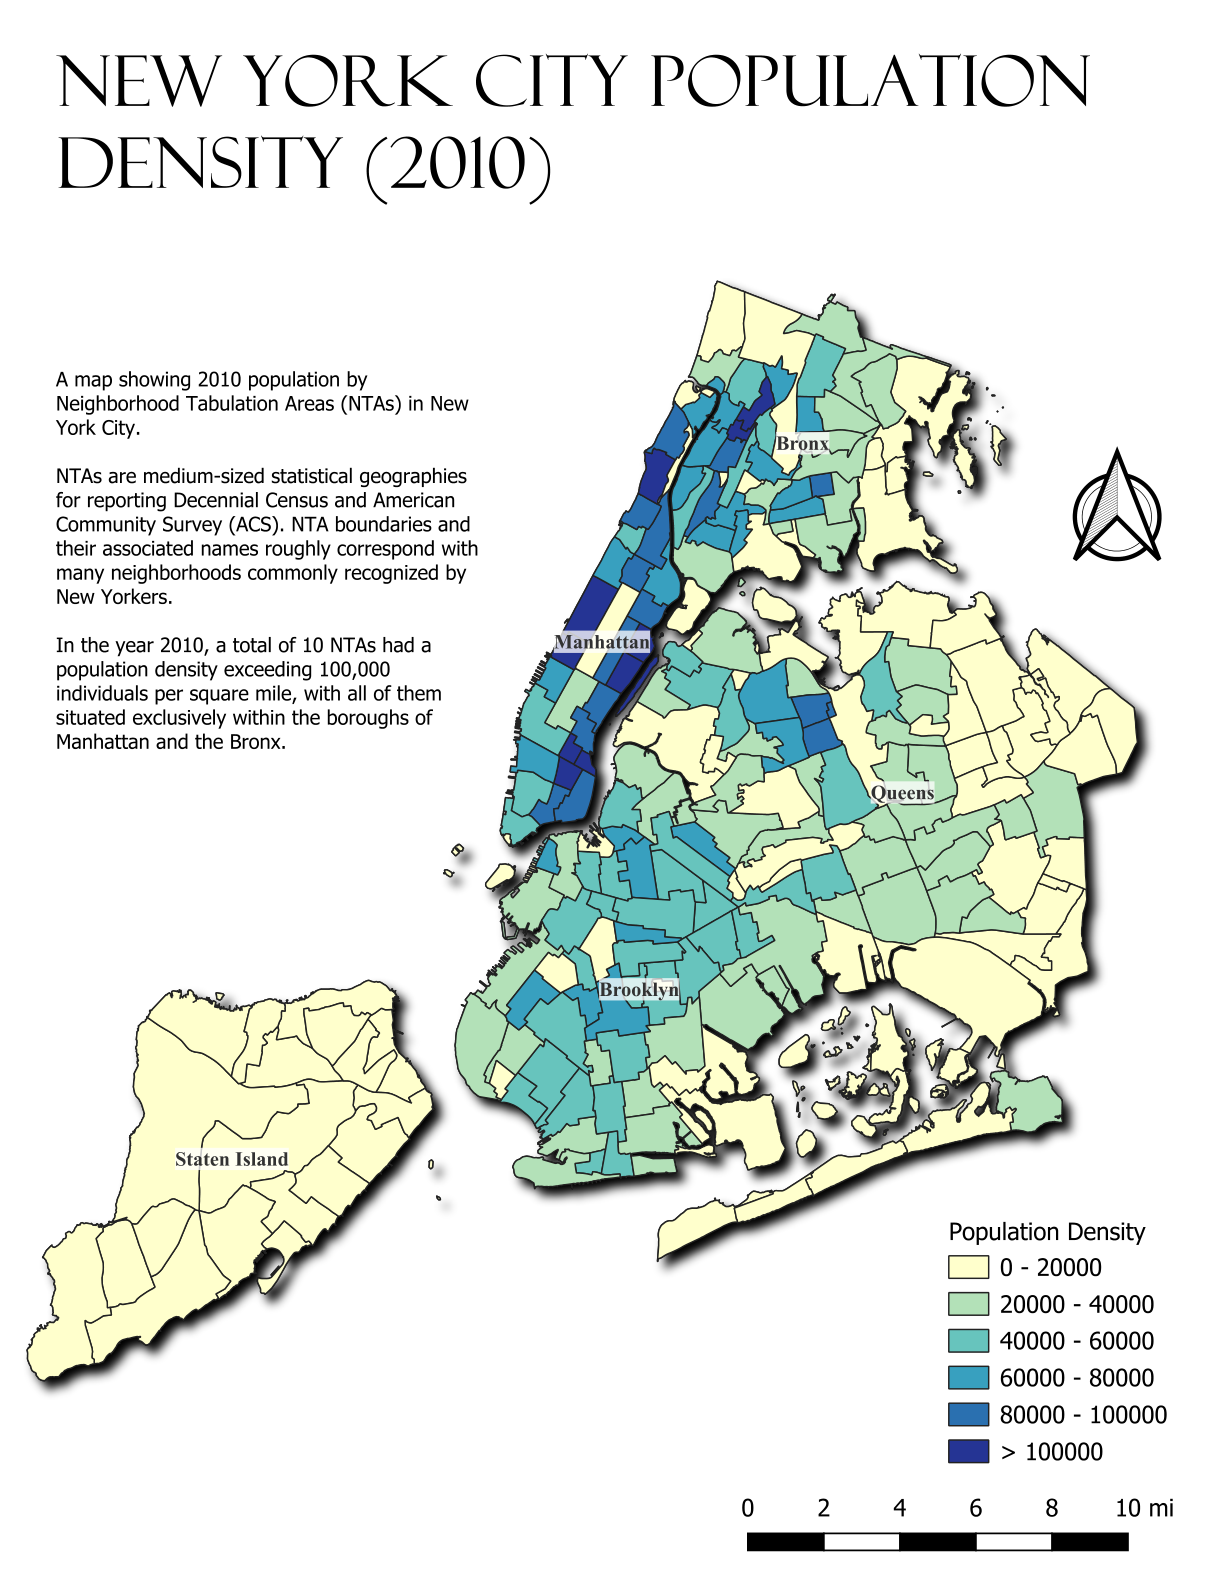 GIS
GIS
NYC Population Density by Neighborhood (2010)
Choropleth map of 2010 Census population density across NYC's Neighborhood Tabulation Areas, revealing sharp borough-level contrasts.
View Project → PowerPoint
Lubumbashi: Mining Rents & Urban Form
Case study examining how copper mining rents shape the spatial structure, labor markets, and built environment of a resource-dependent city in the DRC.
View Presentation → PowerPoint
Brazil 1999: The Samba Effect
Case study of Brazil's 1999 currency crisis — from crawling-peg collapse and ~50% real depreciation to the macroeconomic tripod and V-shaped recovery.
View Presentation → PowerPoint
From Transit to Transformation: Central Asia & South Caucasus
Policy presentation to the World Bank Territorial Development Team on trade corridor soft infrastructure and structural transformation across seven CASC countries.
View Presentation → Power BI
Latin America Conflict & Cartel Violence Dashboard
Interactive Power BI dashboard analyzing 146K ACLED events, 130K fatalities, country rankings, actor patterns, and violence trends from 2019 to 2024.
View Dashboard →