GIS
Urban & Demographic Analysis
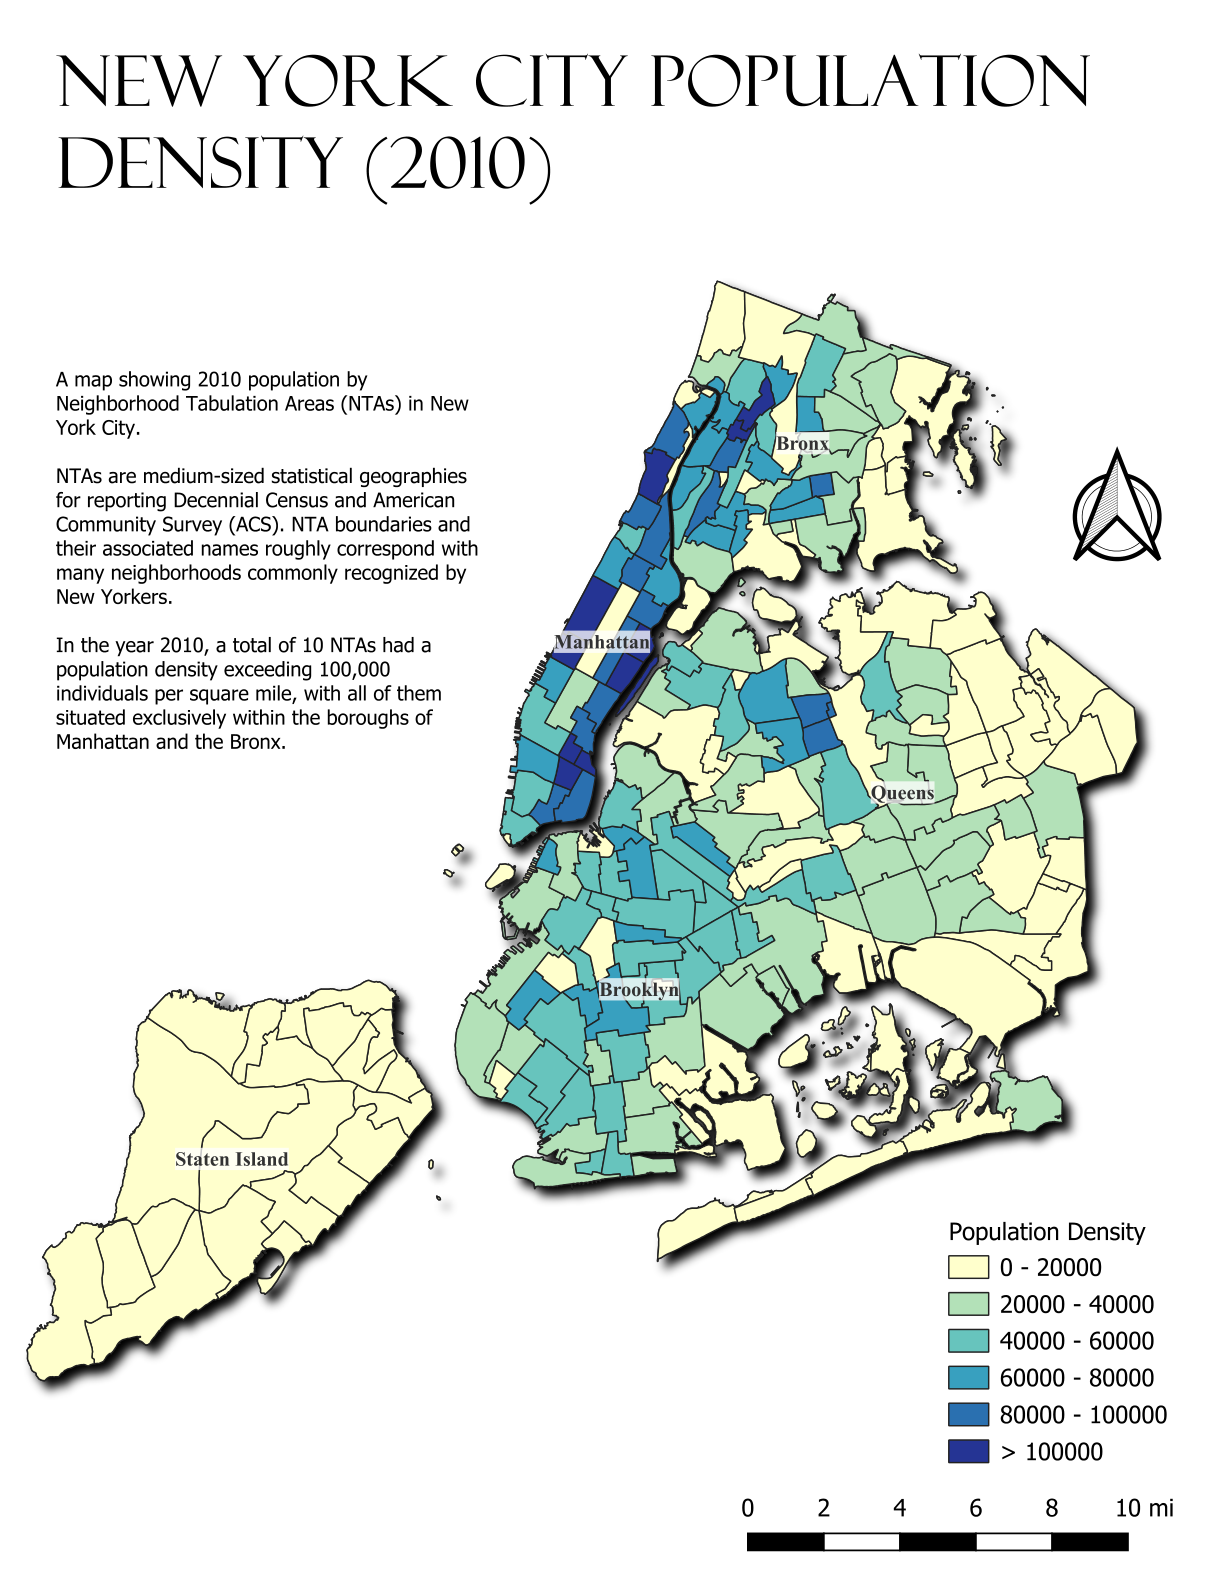
NYC Population Density by Neighborhood (2010)
A choropleth map visualizing 2010 U.S. Census population density across New York City's Neighborhood Tabulation Areas (NTAs) — medium-sized statistical geographies whose boundaries correspond to commonly recognized NYC neighborhoods. The map reveals stark intra-city variation: 10 NTAs exceeded 100,000 residents per square mile, all concentrated in Manhattan and the Bronx, while Staten Island and outer Queens remained well below 20,000 per square mile.
Key Findings
- Mapped population density across all five boroughs using 2010 Decennial Census data joined to NTA boundaries.
- Identified 10 NTAs with density exceeding 100,000 people per square mile, all located in Manhattan and the Bronx.
- Visualized borough-level contrasts: Manhattan and the Bronx anchor the highest-density zones, while Staten Island and outer Queens remain predominantly below 20,000 per square mile.
- Used a six-class sequential color scheme to communicate density gradients clearly across the full range of NYC neighborhoods.
Tools & Methods
QGIS
Choropleth Mapping
Census Data
NTA Boundaries
Spatial Joins
Urban Analysis